Run Observability»
Run Observability helps you understand slow or failing OpenTofu runs. It goes beyond the usual run logs, presenting a set of findings and metrics that together give a much more detailed picture of what happened during the run. You can see them in the dedicated Observability tab of the run view, or query them through the GraphQL API.
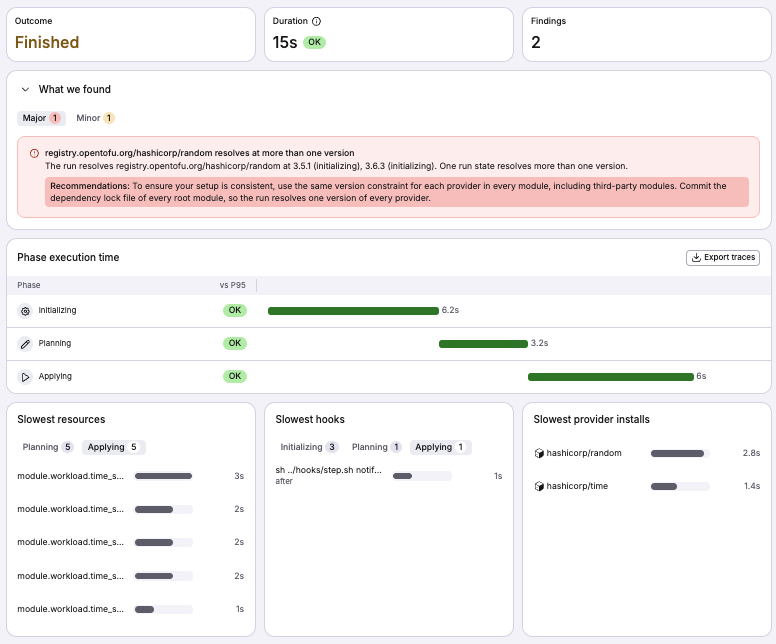
Run Observability is built on OpenTelemetry traces collected from both third-party tooling and Spacelift's internal execution engine. Together, these traces help Spacelift understand the run much better and present two types of insights:
- Run Worker Findings - actionable, high-level findings, each with a clear description and a recommendation. They have their own dedicated section in the UI.
- Run Worker Metrics - single numeric measurements read from the run's trace, for the whole run or for one phase (e.g. time spent in the planning phase). They fuel the widgets in the UI.
Note
OpenTofu emits these traces starting from version 1.10.0.
OpenTelemetry environment variables»
To collect the trace, Spacelift sets the OTEL_* environment variables for each
OpenTofu command. If you set any of these variables yourself, Spacelift does not
set its own, and the Observability tab of the run stays empty:
OTEL_TRACES_EXPORTEROTEL_EXPORTER_OTLP_ENDPOINTOTEL_EXPORTER_OTLP_PROTOCOLOTEL_EXPORTER_OTLP_TRACES_ENDPOINTOTEL_EXPORTER_OTLP_TRACES_PROTOCOL
Reading the Observability tab»
Spacelift collects Observability data only for native OpenTofu stacks. For other stacks, the tab shows no data. Spacelift starts to process the data when the run finishes. The data may take a few minutes to show in the UI.
From top to bottom, the tab shows:
- Stat tiles - a rough high-level overview of the run's outcome
- What we found - all the findings we've discovered, with clear recommendations grouped by severity
- Phase execution time - the duration of each phase, highlighting slow and failed ones
- Breakdown cards - the items that took the most time during the run
Debugging a failed run»
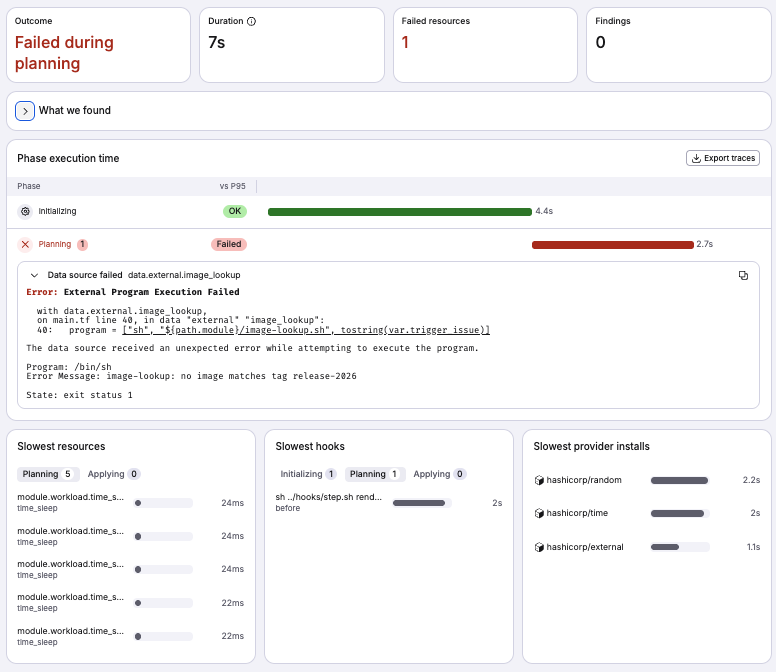
Failed runs often contain one or more errors that are usually hidden in a long run log output. Our main aim here was to highlight the phase of the failed run and present the error so that it is instantly visible.
Note
Starting from OpenTofu 1.12.0, the error is formatted. Earlier versions
show it as plain text.
Sometimes, debugging can be more complex than simply reading the error message. In such a case, export the trace and compare it with your configuration for a more detailed analysis (see Exporting the data).
Debugging a slow run»
Before you debug a slow run, it helps to know what makes a run slow. A run is slow when the whole run, or one of its phases, takes:
- more than twice the P95 duration of earlier runs of the stack, and
- at least 10 seconds longer than that P95.
The P95 (95th percentile) is the duration that 95% of the earlier runs did not exceed. In other words, only 1 in 20 earlier runs took longer. Spacelift calculates the P95 only from finished, tracked runs that reached the apply phase. The stack needs at least three such runs to calculate the P95.
Spacelift detects slow runs and slow phases and shows them in the Observability tab:
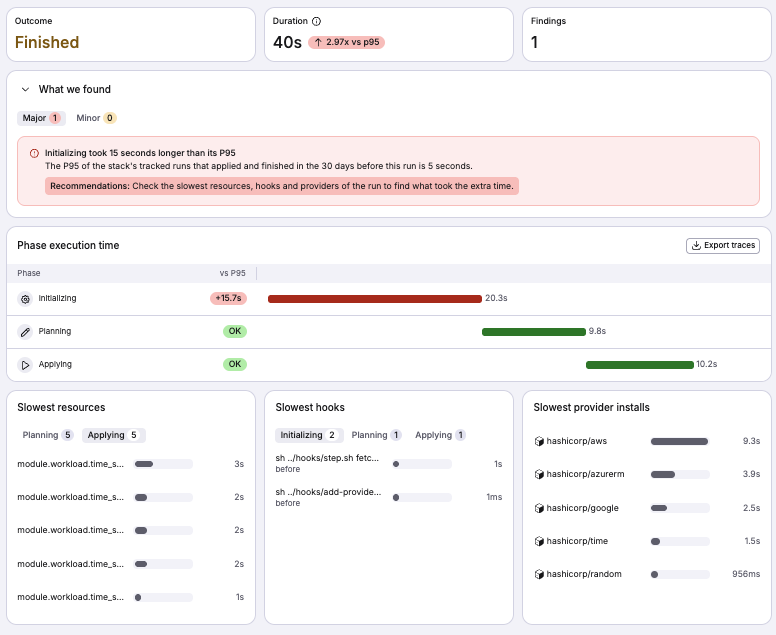
The next step is to understand why it happened. The widgets help you find the cause. For example, Slowest resources shows where the plan or apply spent its time, and Slowest provider installs shows which providers took the longest to install.
While we present high-level insights, which are helpful for understanding what happened, the causes of some slow runs can be very nuanced. In such a case, export the trace and compare it with your configuration for a more detailed analysis (see Exporting the data).
Exporting the data»
Run Observability is built on top of OTEL traces, which can be exported in two ways:
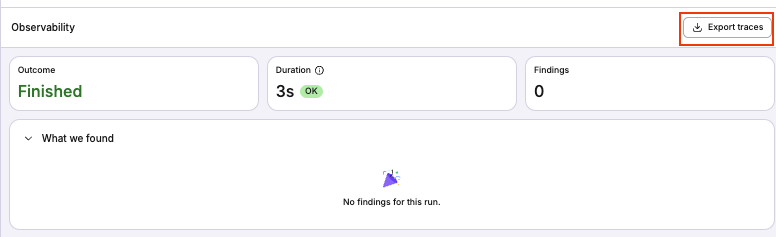
- Export trace button in the UI (see the screenshot) - it downloads a Jaeger-compatible file, meaning you can import it into your local Jaeger instance for manual analysis.
Run.traceSpansGraphQL field - it returns the trace spans page by page, which is useful for loading the trace into your AI agent, using our MCP server.
In addition, all insights, including findings and metrics, can be
exported using the Run.workerFindings and Run.workerMetrics GraphQL fields.
Specification»
Run Worker Findings»
Spacelift evaluates findings after the run ends. Each finding has a title, a
description, a recommendation and a severity: MINOR (worth knowing about) or
MAJOR (worth acting on).
| Finding | Severity | When it shows |
|---|---|---|
ProviderVersionConflict |
MAJOR |
The run resolves one provider at more than one version. |
ProviderVersionChange |
MINOR |
A provider version changed since the last tracked run of the stack. |
ProviderRegistryDuplicate |
MINOR |
The run resolves one provider from both registry.opentofu.org and registry.terraform.io. |
SlowProviderInstallCacheDisabled |
MINOR |
A run on a private worker pool installs a provider slowly and has no provider cache. |
SlowState |
MINOR or MAJOR |
A phase took much longer than the stack's P95 for that phase (see Debugging a slow run). |
Each run also gets an outcome. The outcome category goes from best to worst:
| Category | Meaning |
|---|---|
Healthy |
The run finished in a normal time and has no findings. |
Finished |
The run finished in a normal time and has at least one finding. |
Slow |
The run finished, but the whole run or one of its phases was slow (see Debugging a slow run). |
Interrupted |
The run was stopped, canceled, discarded or skipped. |
Failed |
The run failed. |
Run Worker Metrics»
Spacelift compares each duration with the P95 of the same duration across earlier runs of the stack. By default, the comparison uses the last 30 days.
| Metric | What it measures |
|---|---|
| Run duration | The time the run spent on the worker. |
| Phase duration | The time each phase took: initializing, planning, applying, destroying or performing. |
| Phase errors | The errors that made a phase fail. |
| Slowest resources | Up to 5 resources each phase spent the most time on. |
| Slowest hooks | Up to 5 hooks each phase spent the most time on. |
| Failed resources | The number of failed resources, by phase and resource type. |
| Slowest providers | Up to 5 providers that took the longest to install. |
| Slowest modules | Up to 5 modules that took the longest to install. |