Usage»
Download Usage Data»
Usage data can be downloaded:
- from the Usage page: Organization Settings -> Other -> Usage
- using spacectl command:
spacectl profile usage-csv - via the Spacelift API at
https://<your-spacelift-host>/usageanalytics/csv(note: this is not a GraphQL endpoint)
Analyzing Usage Data»
Load CSV data into PostgreSQL»
Create a table for worker count and load the CSV file into the table:
1 2 3 4 5 6 | |
1 | |
And the same for run minutes:
1 2 3 4 5 6 7 8 9 10 11 12 13 14 | |
1 | |
ELK stack»
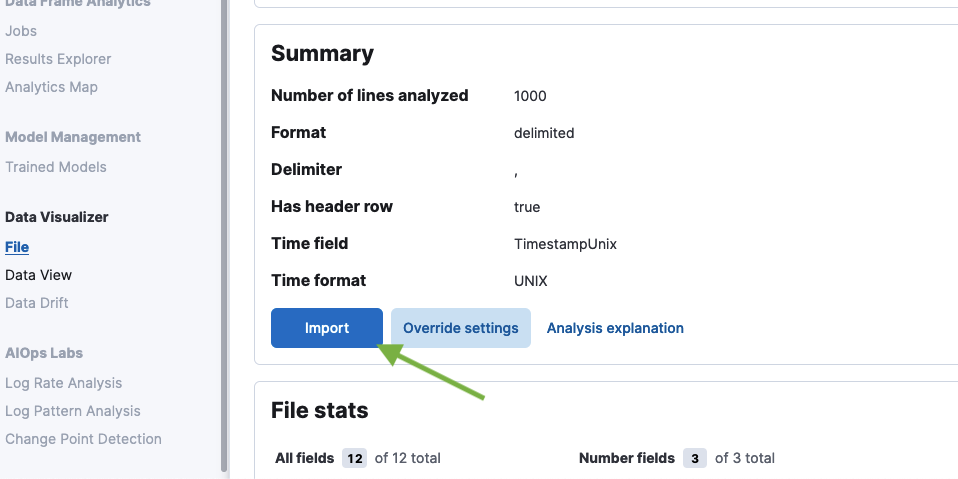
CSV files can be easily imported into Elastic Stack for visualization. The following example shows how to import your csv data into Kibana using Data Visualizer.
Steps:
-
Download the CSV file.
1spacectl profile usage-csv -aspect run-minutes > usage.csvNote: the exported CSV data doesn't contain zero values, so percentile calculations will be incorrect. To fix this, you can add zero values to the CSV file before processing it.
-
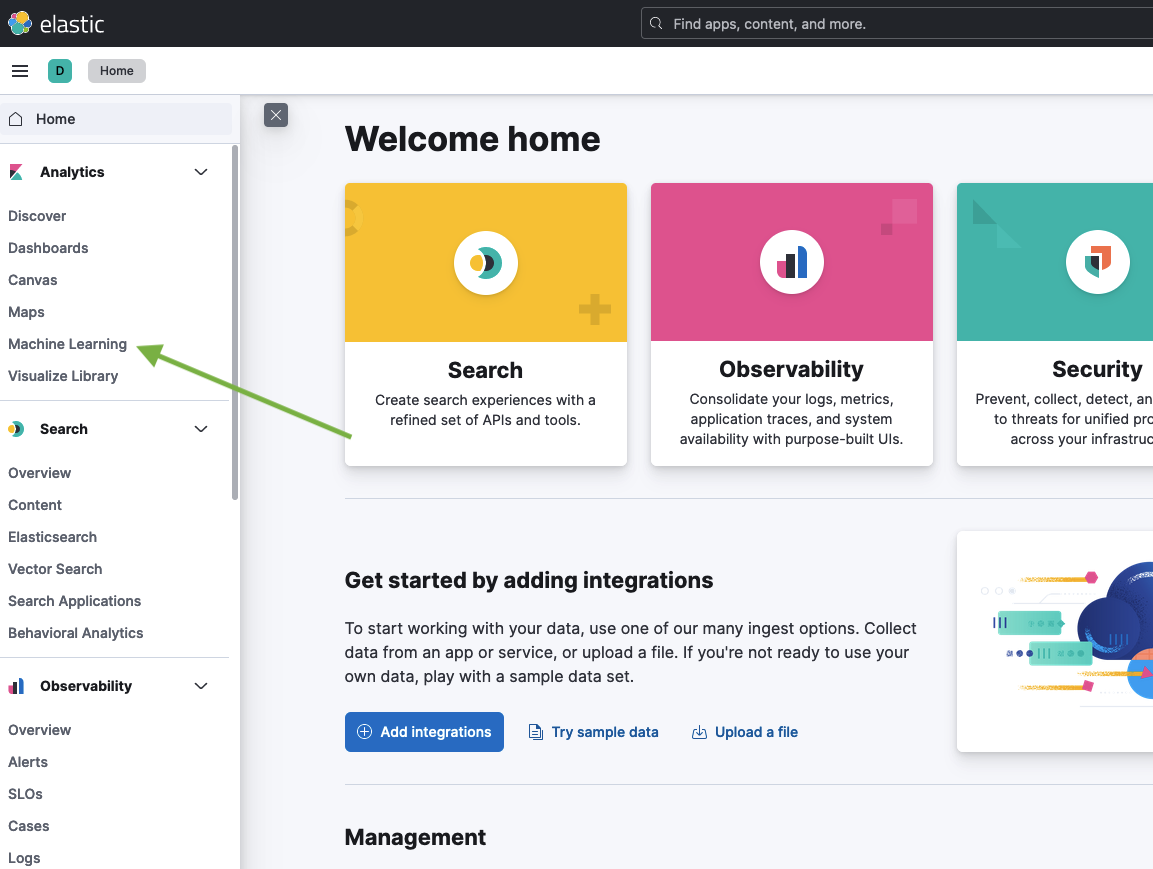
Open Kibana and go to Machine Learning
-
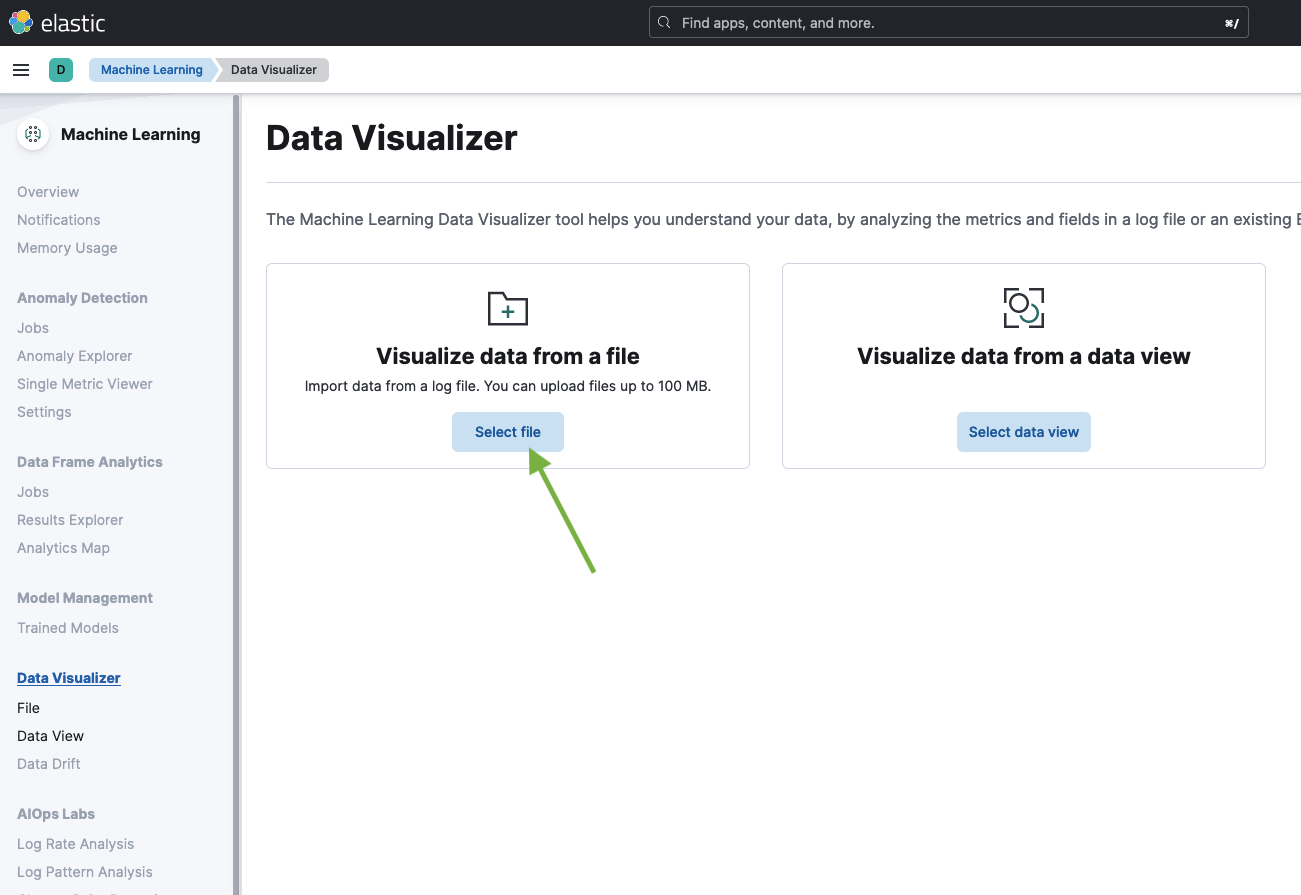
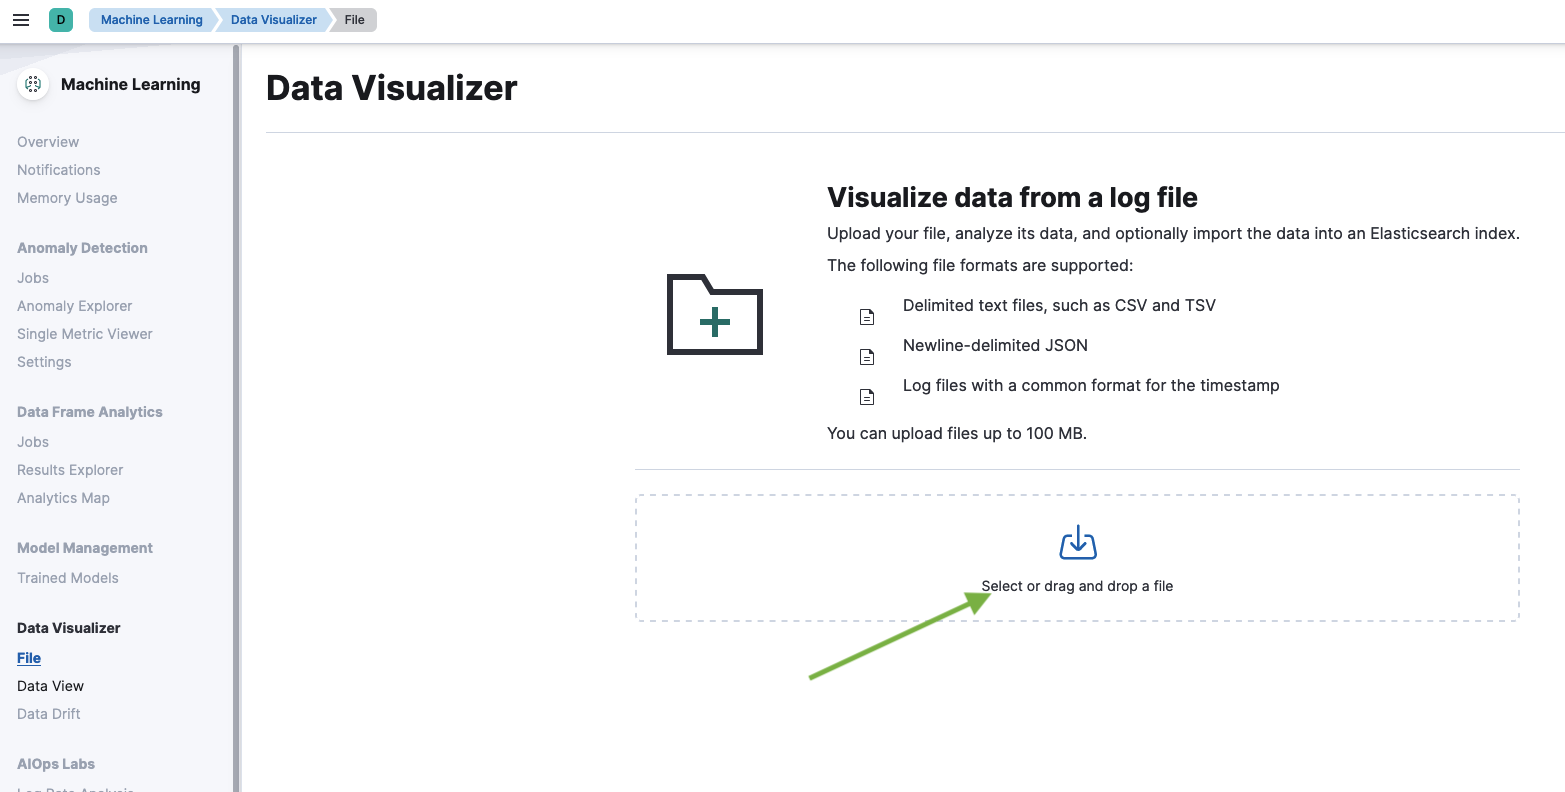
Select the CSV file.
-
Use the mappings that were automatically generated by Kibana.
-
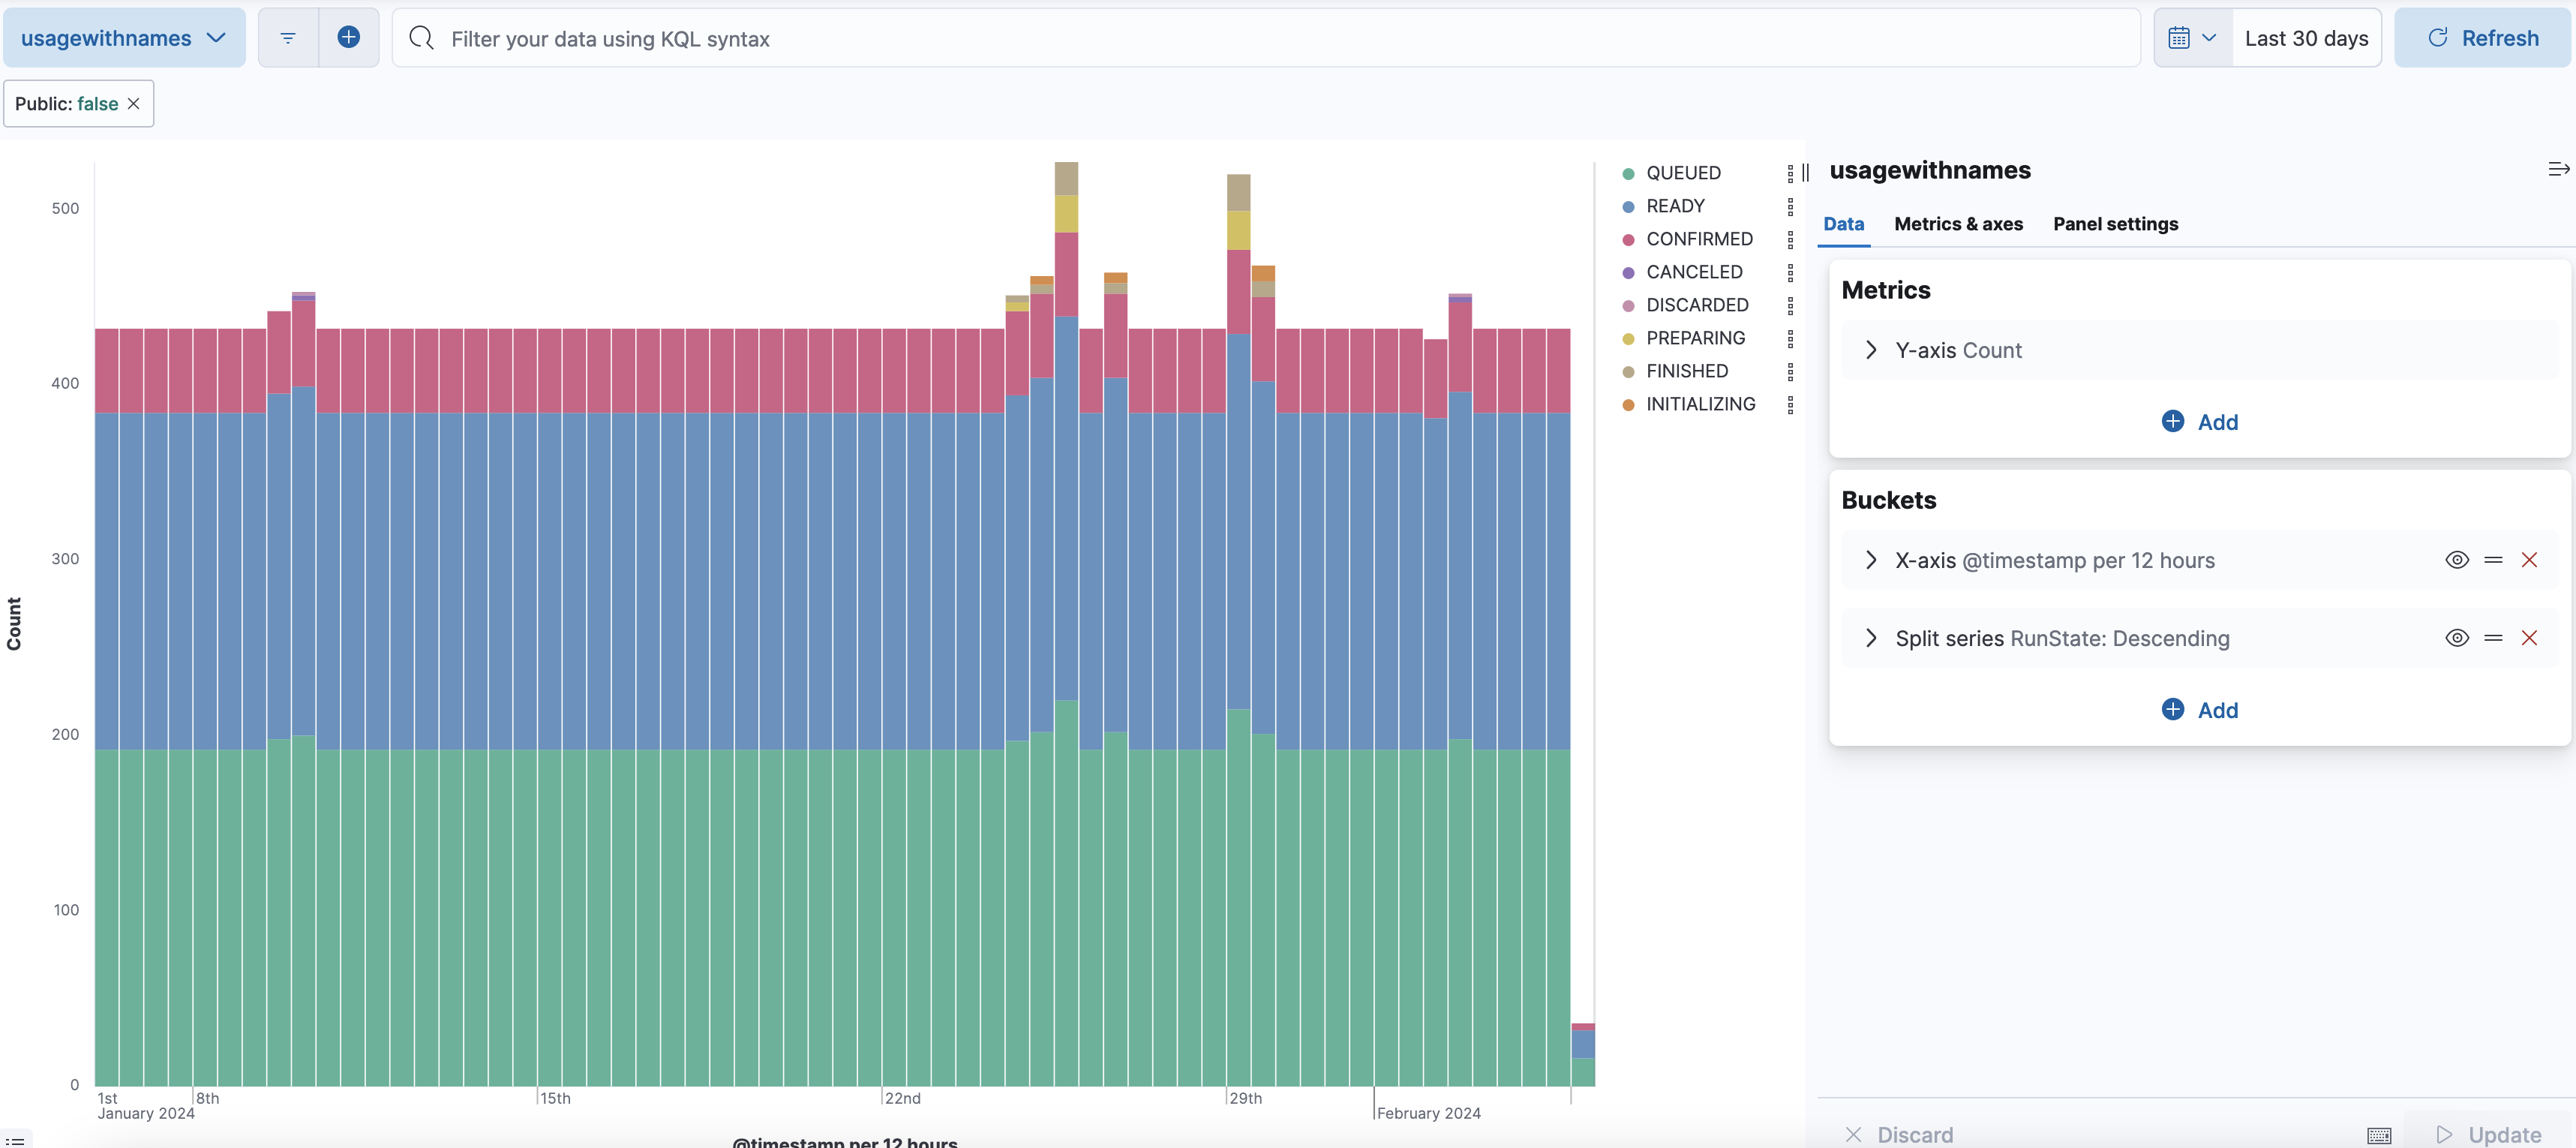
Create a visualization using the imported data.
Here's an example of a visualization that shows the number of run minutes on private workers, broken down by the run state: