Dashboard»
The dashboard is the first page you see when logging into Spacelift. It provides an overview of your account and the status of your infrastructure.
Non-admin users can view most dashboard widgets, with the exception of the Launch Pad and User Activity, which are available only to admins.
Users only see stacks and runs that belong to spaces they have access to. If a user does not have read permissions for a given space, no information from that space is displayed on the dashboard.
Predefined views»
The Dashboard comes with three predefined views: Overview, Metrics, and DORA. You can switch between them by clicking on the tabs at the top of the page.
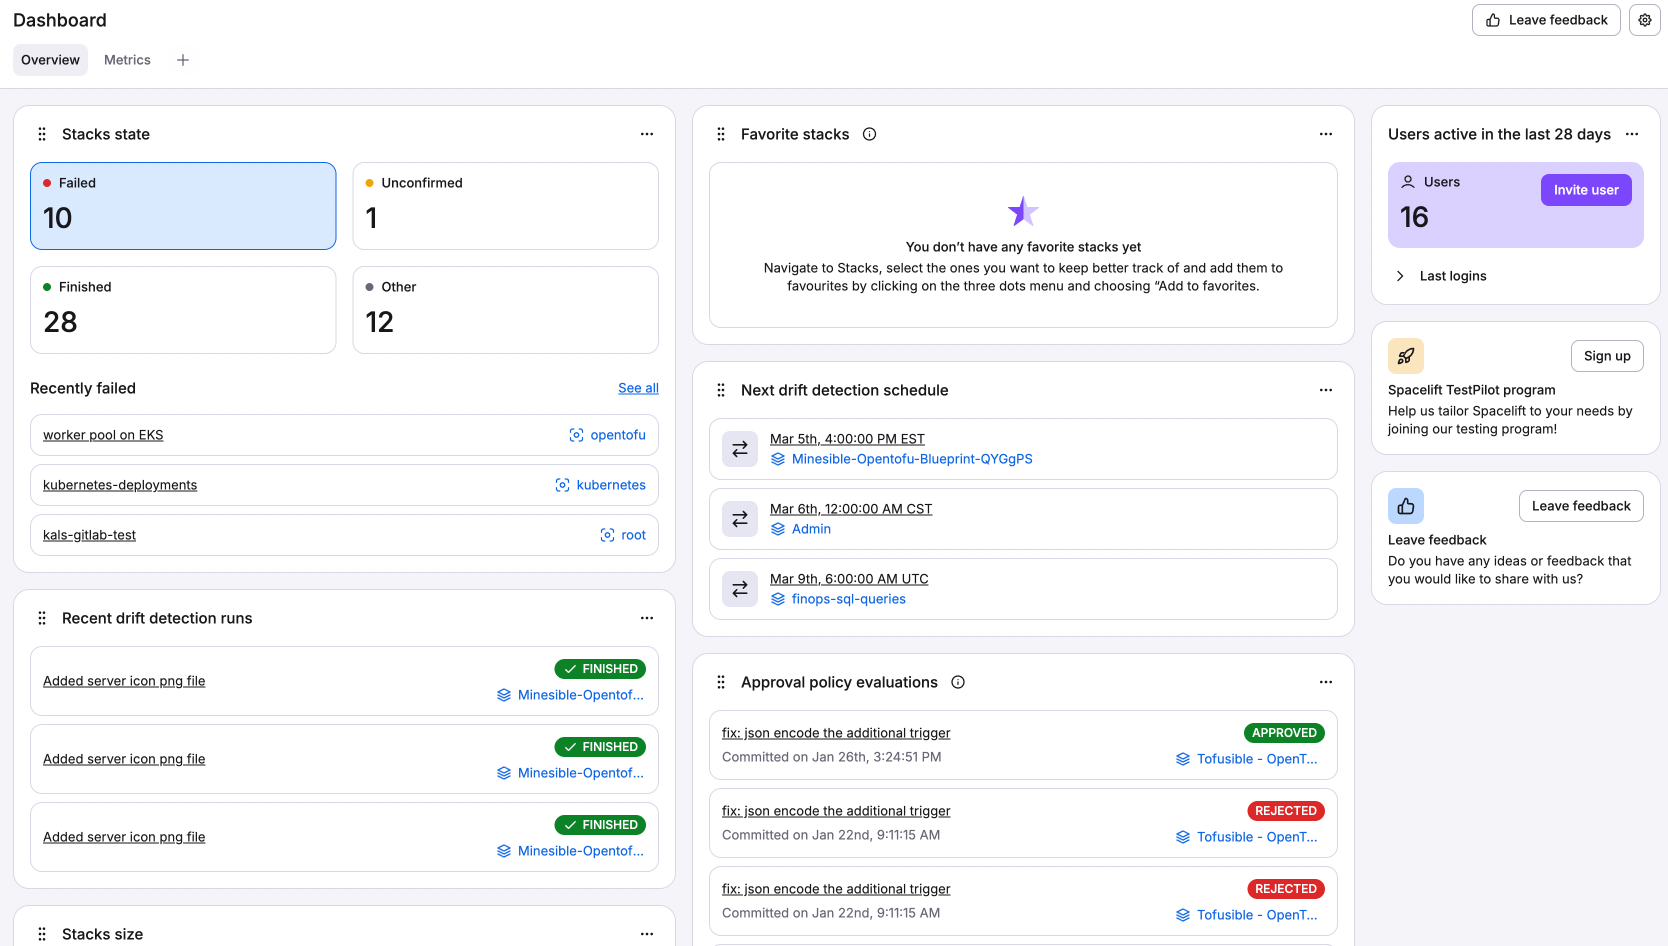
Overview»
Contains widgets for basic information about your infrastructure, such as the state of your stacks (failed, unconfirmed, finished, etc.), active users, drift detection runs, approval policy evaluations, etc.
Metrics»
Spacelift tracks seven main metrics to provide an overview on the health of your infrastructure. Select the Metrics tab on the Dashboard page to view the metrics for your organization.
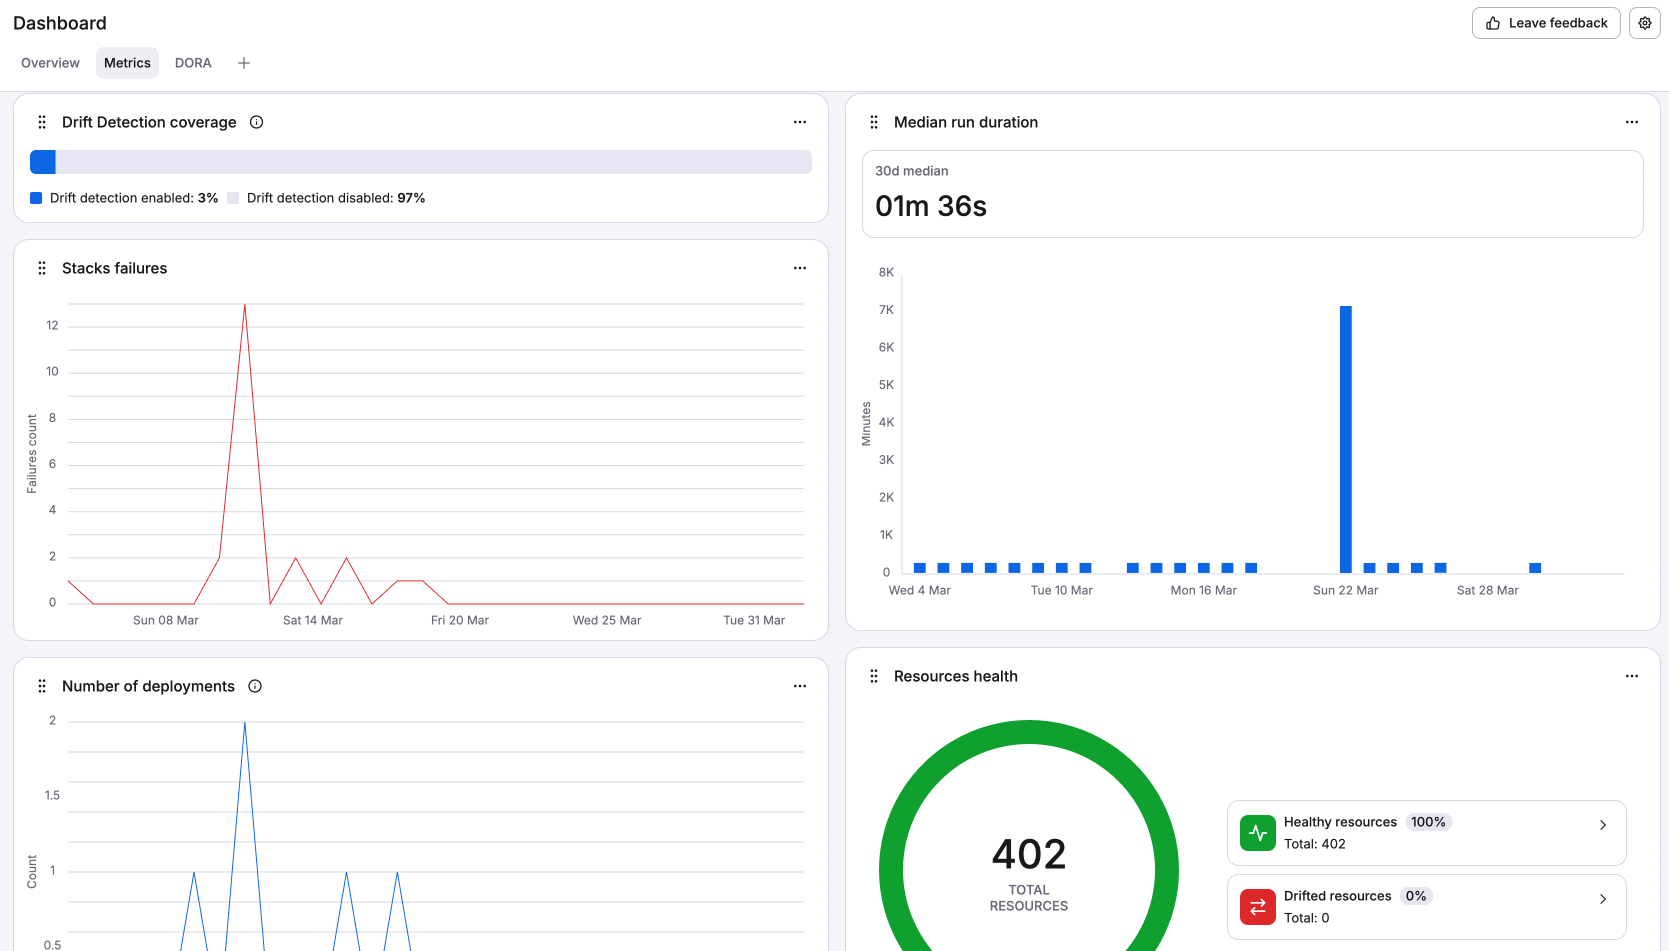
- Drift detection coverage: The percentage and number of your stacks that have enabled drift detection.
- Stacks failures: The number of stacks entering the
failedstate per day, over the past 30 days. - Number of deployments: The number of tracked runs that
finishedsuccessfully per day, over the past 30 days. - Managed resources: A pie graph showing the percentage and number of your resources by vendor (OpenTofu, Terraform, Kubernetes, etc.).
- Median run duration: The mathematical median of all run durations across your infrastructure over the past 30 days.
- Average run duration: The mathematical average of all run durations across your infrastructure over the past 30 days.
- Resources health: A pie graph showing the percentage and number of healthy resources and drifted resources across your infrastructure.
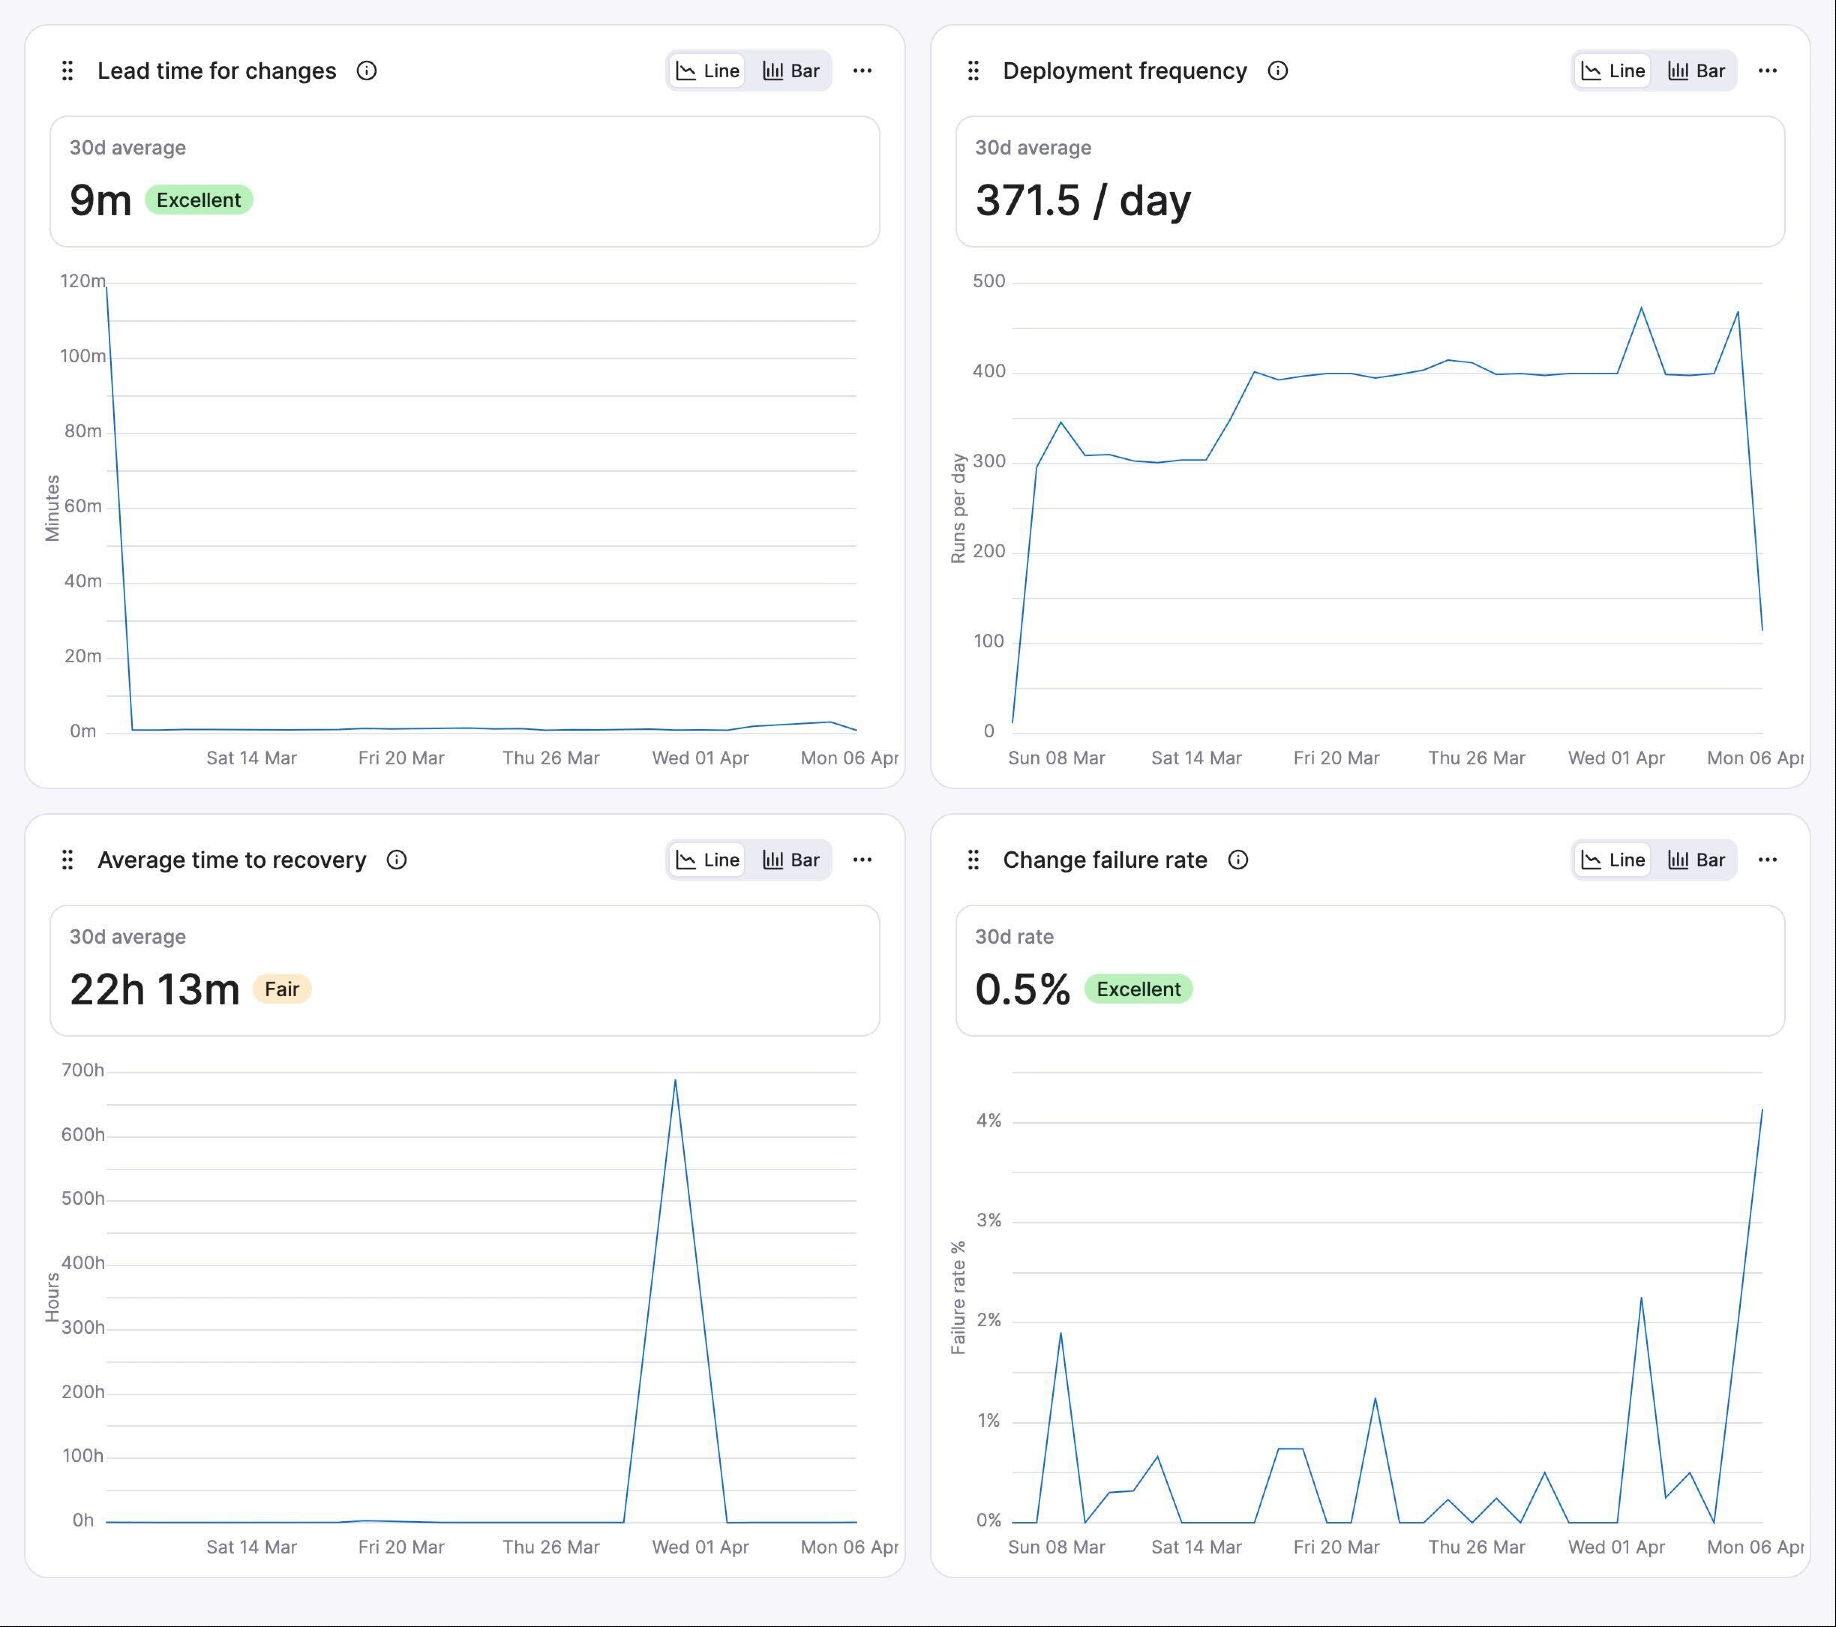
DORA metrics»
DevOps Research and Assessment (DORA) metrics are industry-standard ways to measure and improve DevOps and software delivery performance. Spacelift tracks four standard DORA metrics on tracked change runs in non-deleted, non-module stacks.
- Deployment frequency: Successful deployments per day. Counts state transitions from
applyingtofinished. A run must successfully be applied to count as a deployment. - Lead time for changes: Time from pull request (PR) opened to deployment complete. Only runs in the
finishedstate are counted. - Change failure rate: Ratio of
faileddeployments to total completed deployments (failedandfinished). Any other terminal states (such asdiscardedorstopped) are excluded, as they aren't considered deployments. - Average time to recovery: How long it takes to recover from a failure. Also called mean time to recovery (MTTR). Measured by the time between a
failedrun and the next successful run on the same stack.
Select the DORA tab on the Dashboard page to view the DORA metrics for your organization.
In summary:
| Metric | Key run states | Formula | What's counted |
|---|---|---|---|
| Deployment frequency | Applying > Finished | count(Applying > Finished transitions) / days in range | Successful deploys per day |
| Lead time | Finished (by PR) | (run_created_at - pr.opened_at) + run_duration | PR open and deploy finished |
| Change failure rate | Failed, Finished | count(Failed) / count(Failed + Finished) | Failure ratio |
| MTTR | Failed, next Finished (same stack) | (recovery.created_at - failure.created_at) / days in range | Recovery time |
States like canceled, stopped, discarded, and skipped do not factor into any DORA metric.
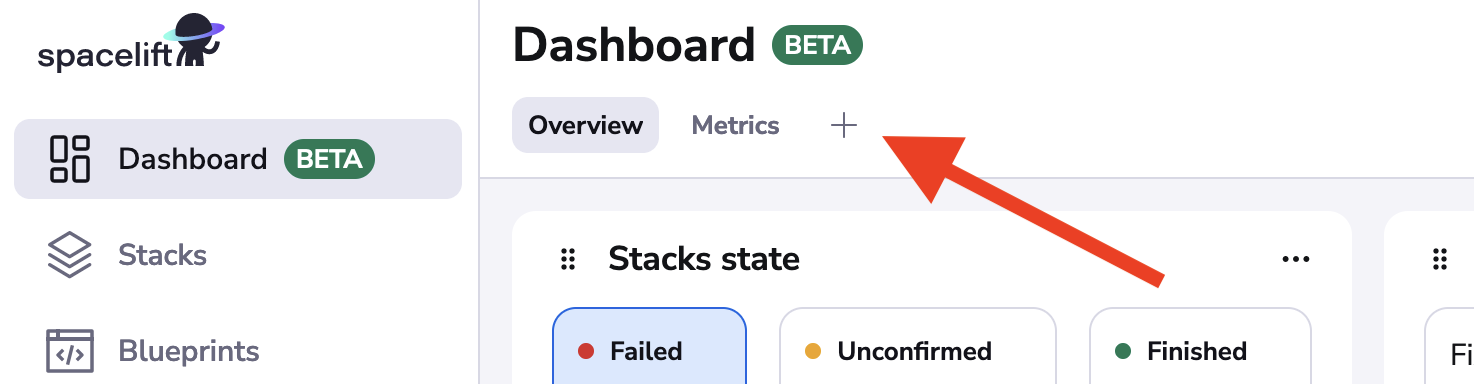
Creating a new view»
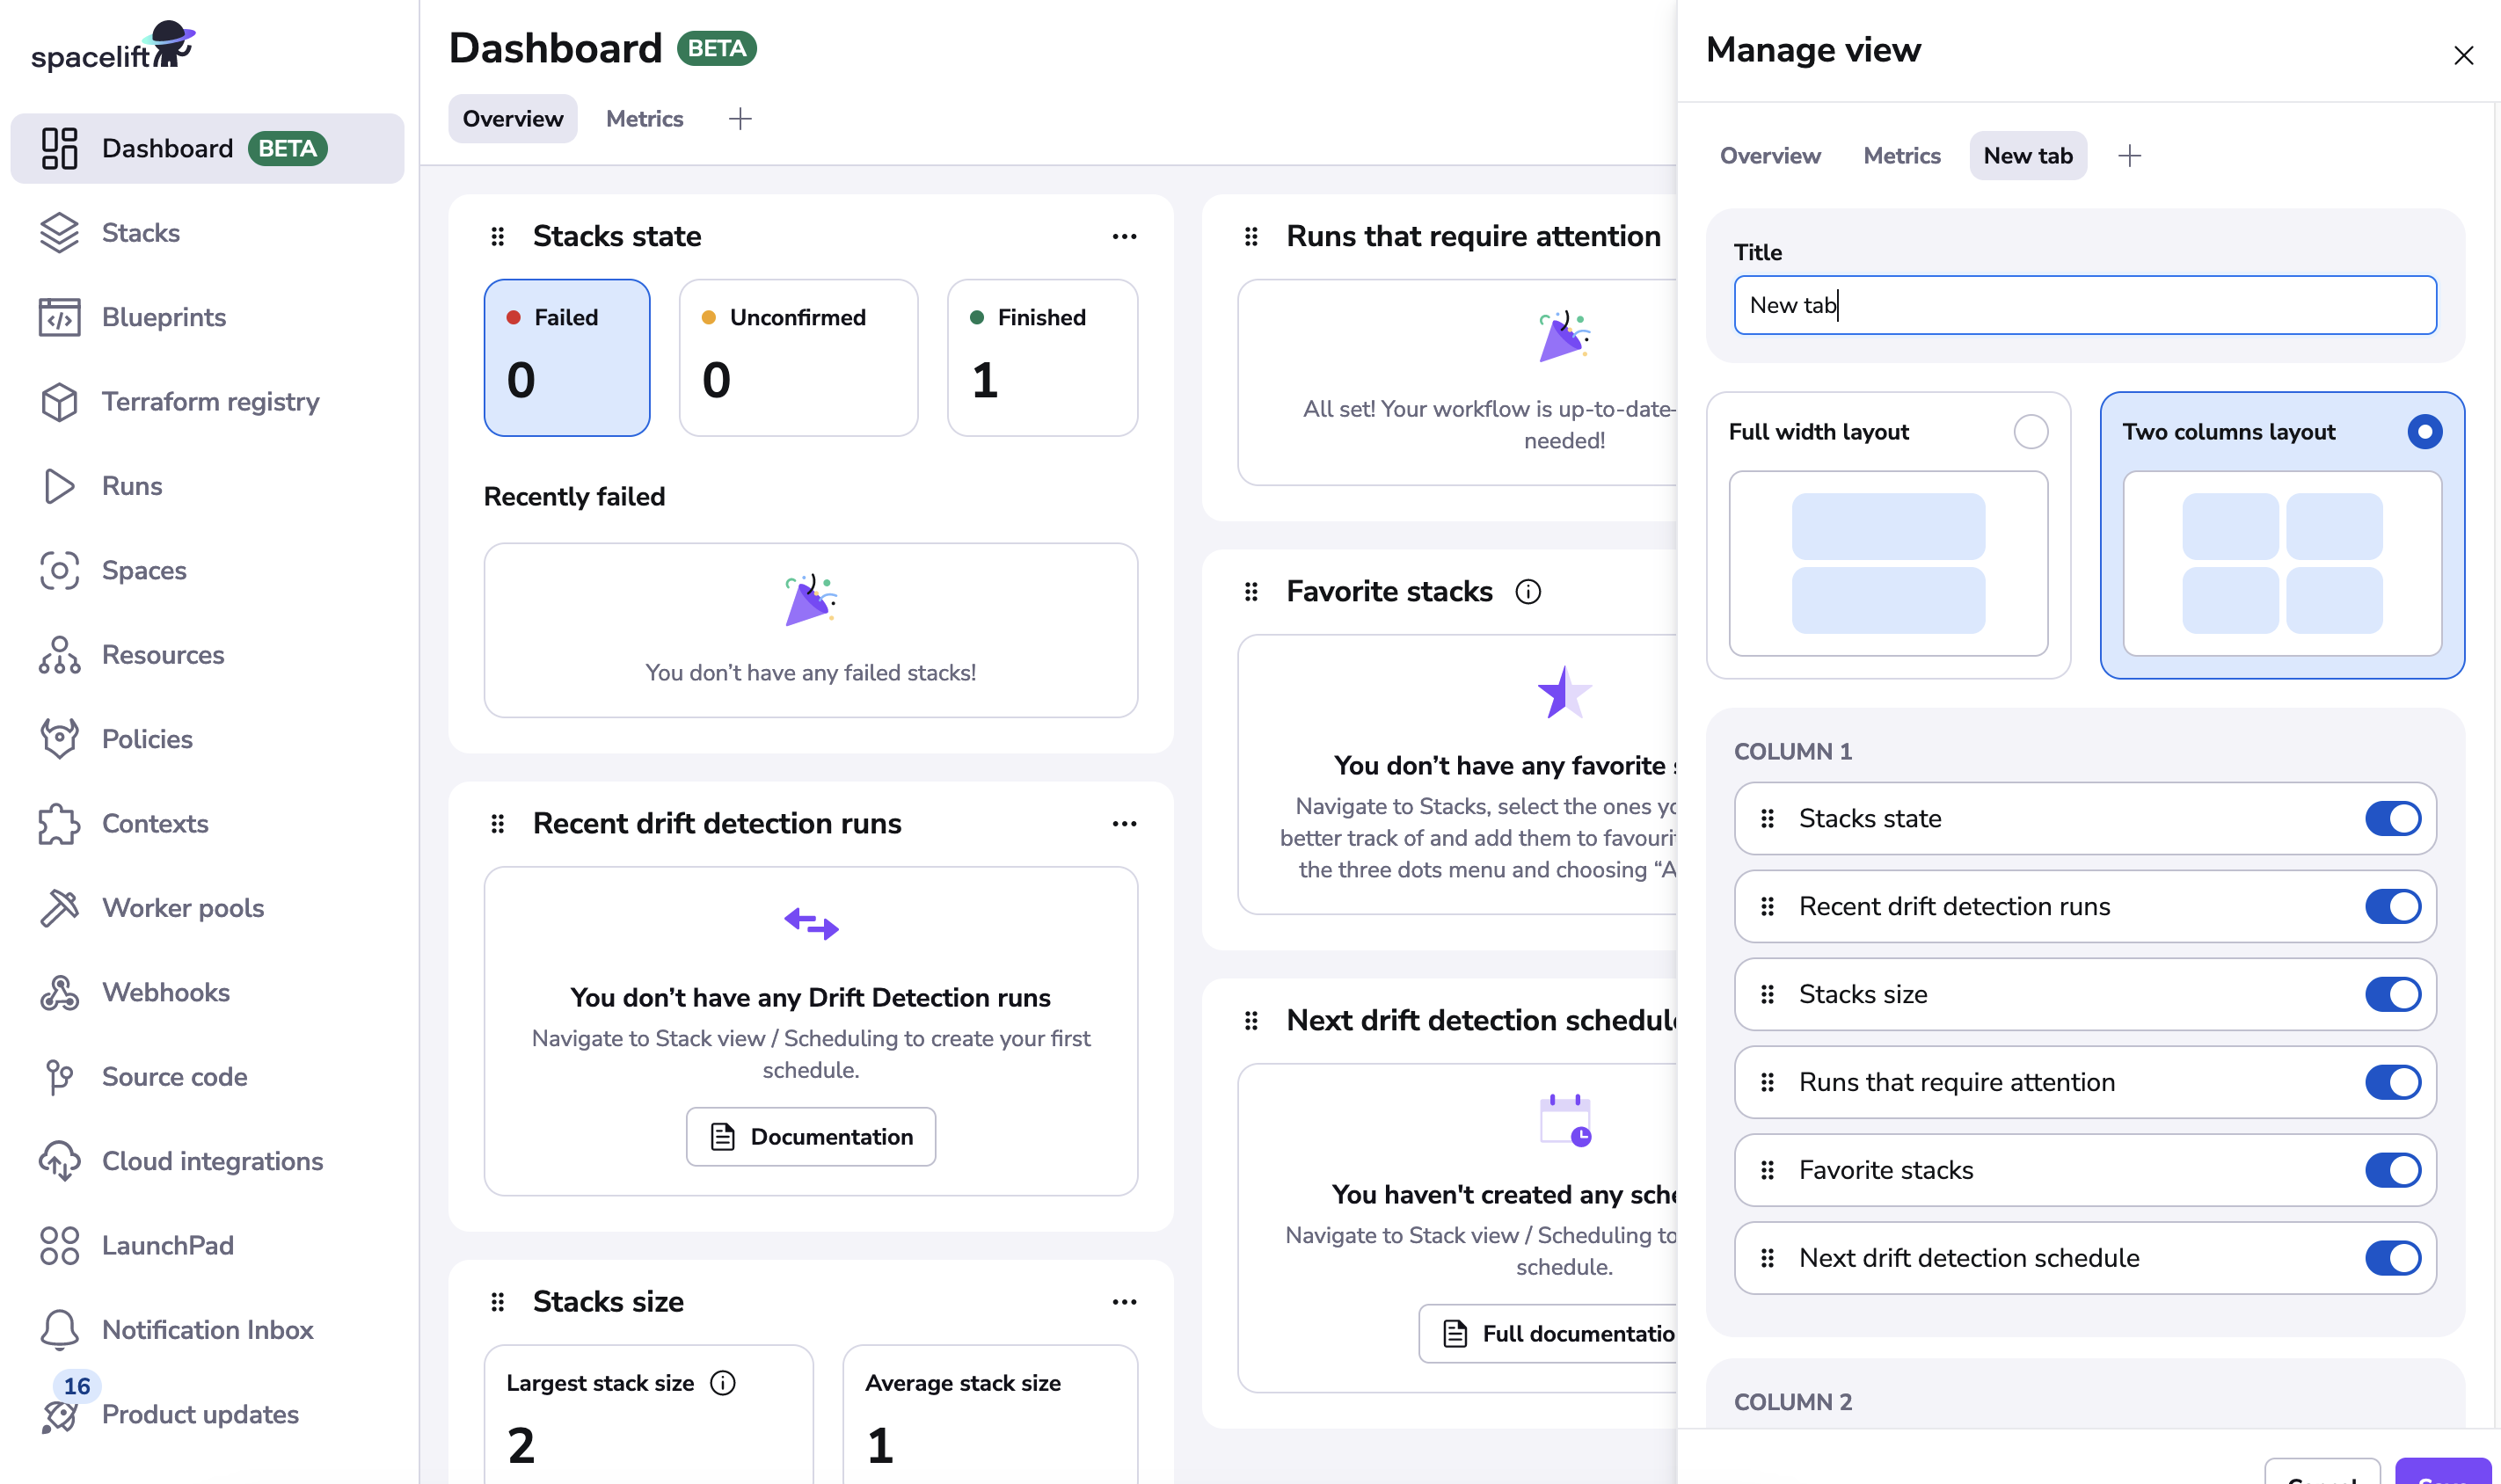
You can also create your own views to customize the dashboard to your needs. To create a new view, click + Add new tab next to the existing tabs.
Customize the layout settings for your new dashboard view and choose the widgets you want to display in the Manage views drawer.
Changing the landing page»
The landing page of the app is the first page you see when you log in. By default, it is set to the dashboard.
To change the landing page:
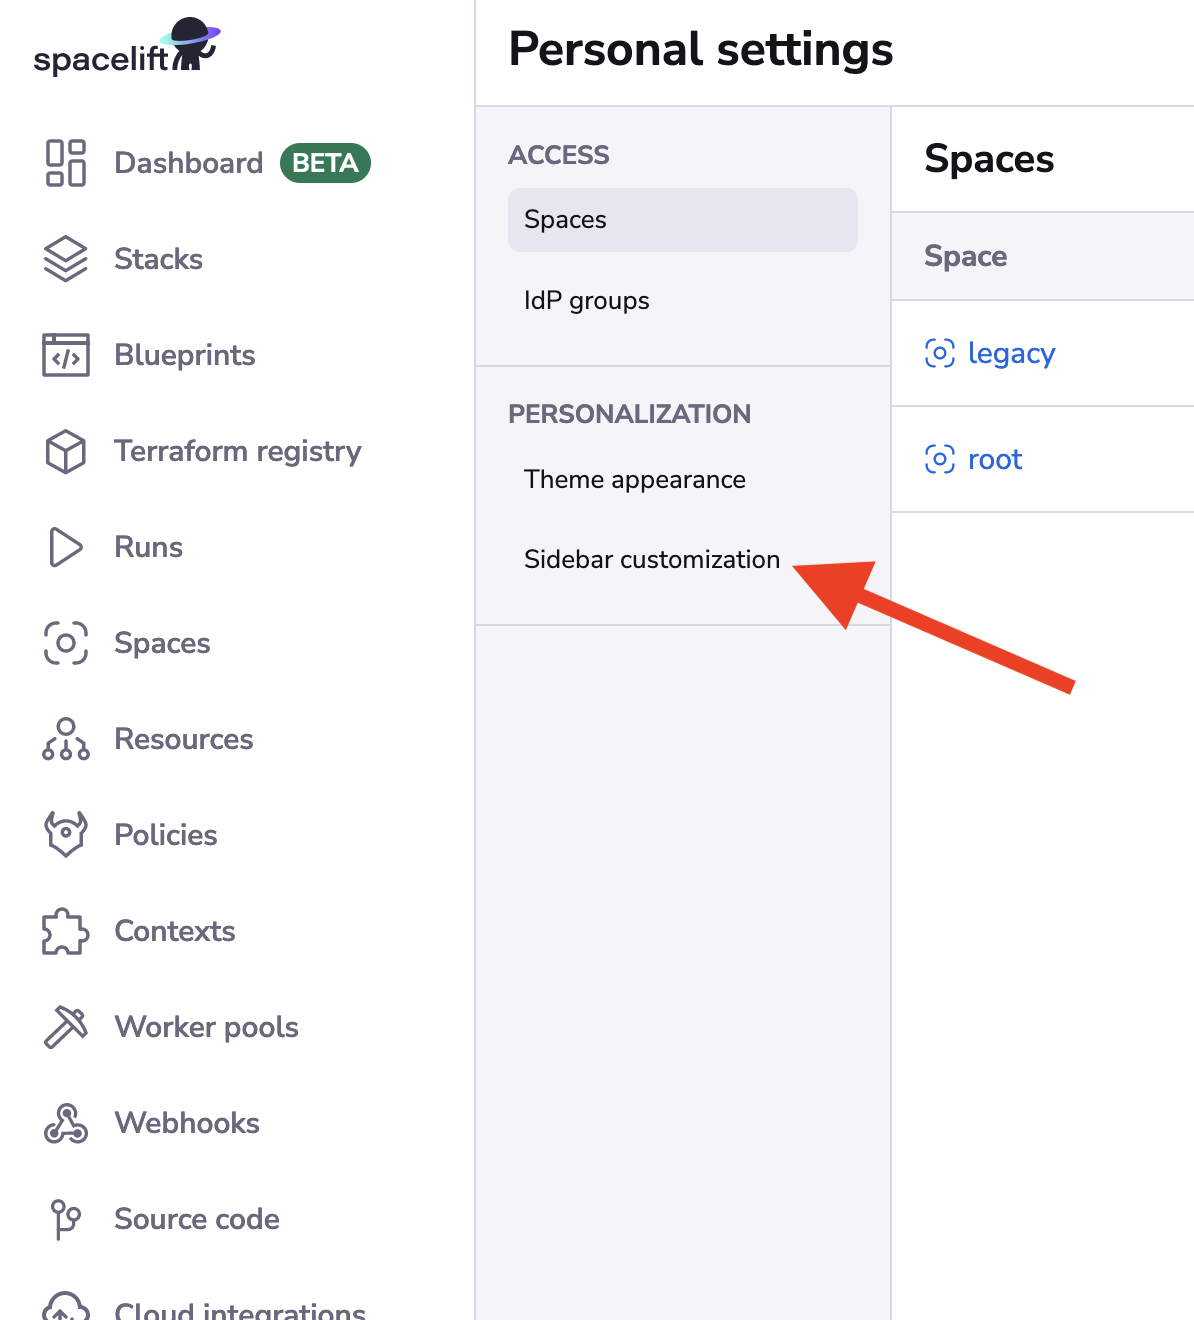
- Hover over your profile in the bottom-left corner and click Personal settings.
- In the Personalization section, click Sidebar customization.
- Click the dropdown under Default view and select which landing page you want.
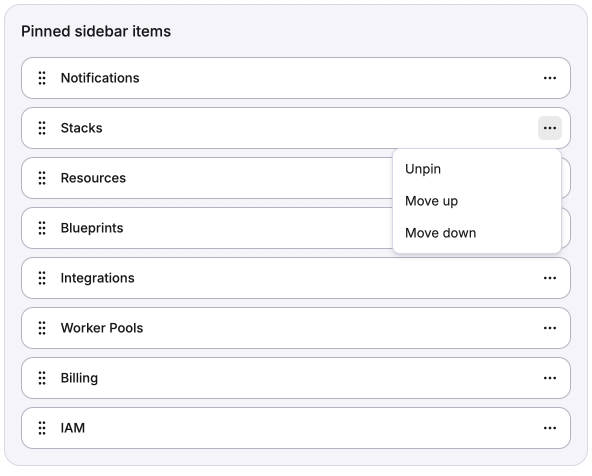
You can also view, edit, and rearrange any pages you have pinned in the sidebar.