OpenTelemetry with Grafana stack in Kubernetes»
This guide provides a way to configure OpenTelemetry with Grafana stack for your Spacelift installation running in Kubernetes.
OpenTelemetry is a set of open standards and tools for collecting, processing, and exporting telemetry data such as traces and metrics. Unlike monolithic observability solutions, OpenTelemetry focuses on data collection and standardization rather than storage or visualization. This flexibility allows you to use various compatible backends and user interfaces based on your needs.
OpenTelemetry doesn't define a storage layer or user interface - instead, it provides a standardized way to collect and export telemetry data to various backends. There are many OpenTelemetry-compatible tools available, including Grafana Tempo, Jaeger, Zipkin, Prometheus, and commercial offerings like Grafana Cloud and Datadog. In this guide, we'll use Grafana Tempo as the storage backend and self-hosted Grafana as the user interface to visualize traces.
Architecture overview»
The telemetry pipeline consists of three main components:
- Spacelift applications (server, drain, scheduler) - Emit trace data
- OpenTelemetry Collector - Receives, processes, and forwards telemetry data
- Storage and visualization - Grafana Tempo stores traces, Grafana UI queries and displays them
The OpenTelemetry Collector acts as a relay that receives traces from Spacelift applications and forwards them to the storage backend. It doesn't store any data itself - it's purely a middleware component that allows you to decouple your applications from specific backend implementations.
flowchart LR
    A[Spacelift Server] --> D[OpenTelemetry Collector]
    B[Spacelift Drain] --> D
    C[Spacelift Scheduler] --> D
    D --> E[Grafana Tempo<br/>Storage Layer]
    F[Grafana UI] -.Query.-> E
Info
For more information about telemetry configuration options and supported backends, see the telemetry reference documentation.
Prerequisites»
Before proceeding with the installation, ensure you have:
- A running Spacelift installation in Kubernetes.
- kubectl configured to access your cluster.
- Helm 3 or later installed.
Install Grafana stack: Tempo»
Grafana Tempo is an open-source distributed tracing backend that serves as the storage layer for trace data. It stores traces from your distributed systems and allows you to search and retrieve them by trace ID. Think of it as a specialized database optimized for trace storage - Grafana UI will query this database to visualize request flows across your Spacelift services. Let's start by installing the storage layer.
Add Helm repository»
First, add the Grafana Helm repository and update it:
1 2 | |
Create monitoring namespace»
Create a dedicated namespace to hold all monitoring-related resources:
1 | |
Tip
Using a dedicated namespace makes it easy to manage monitoring components. You can remove everything by simply deleting the namespace, which automatically cleans up all resources inside it.
Install Tempo»
Create a values file for Tempo configuration. Save the following as tempo-values.yaml:
| tempo-values.yaml | |
|---|---|
1 2 3 4 5 6 7 8 9 10 11 | |
- Disables telemetry reporting to Grafana Labs.
- Retention period for traces. Adjust based on your needs.
Install the Tempo chart:
1 | |
Configure storage backend»
Warning
By default, Tempo uses local storage which is ephemeral - all traces are lost when the Tempo pod restarts. This is fine for testing and demo purposes, but not suitable for production use.
For production environments, configure an object storage backend like S3, Google Cloud Storage, or Azure Blob Storage. Here's an example configuration for AWS EKS:
Click to expand tempo-values.yaml (production with S3)
| tempo-values.yaml (production with S3) | |
|---|---|
1 2 3 4 5 6 7 8 9 10 11 12 13 | |
For more details about storage configuration, see the official Tempo storage documentation.
Maintenance and upgrades»
The Helm chart uses the same version for the Tempo Docker image as the chart version (Chart.AppVersion). To upgrade to a newer version, upgrade the Helm chart itself:
1 | |
Then upgrade to the desired version:
1 | |
Install OpenTelemetry Collector»
The OpenTelemetry Collector functions as a relay that receives telemetry data from your applications and forwards it to backend systems. It acts as middleware between your Spacelift services and the storage layer (Tempo), handling tasks like batching, retries, and data transformation. The Collector doesn't store any data itself - it simply processes and routes telemetry to the appropriate backends. Let's install it next.
Add Helm repository»
If you haven't already, add the OpenTelemetry Helm repository:
1 2 | |
Configure the collector»
Create a values file for the OpenTelemetry Collector. Save the following as otel-collector-values.yaml:
Click to expand otel-collector-values.yaml
| otel-collector-values.yaml | |
|---|---|
1 2 3 4 5 6 7 8 9 10 11 12 13 14 15 16 17 18 19 20 21 22 23 24 25 26 27 28 29 30 31 32 33 34 35 36 37 38 39 40 41 42 43 44 45 46 | |
This configuration:
- Disables all receivers except OTLP (which Spacelift uses via gRPC on port 4317)
- Configures the OTLP exporter to forward traces to Tempo
- Disables unnecessary listener ports for protocols we don't use
- Uses the
nop(no-operation) exporter for metrics - this drops metrics data since Tempo only handles traces, not metrics. However, it's important to define ametricspipeline because Spacelift applications emit both traces and metrics. Without a metrics pipeline, the collector would reject the metrics data, causing errors. If you're using a backend that supports both traces and metrics (like Jaeger, Grafana Cloud, or Datadog), you can changeexporters: [nop]toexporters: [otlp]in the metrics pipeline to send metrics to the same backend.
Traces vs Metrics
OpenTelemetry supports multiple types of telemetry data: traces (request flows across services), metrics (numerical measurements like queue size, visible messages in the queue, request counts, error rates, latency percentiles), and logs (event records). Tempo is a specialized tracing backend that only stores traces. If you need to store metrics as well, you would need to configure a separate metrics backend (like Prometheus or Mimir) and add it as an additional exporter in the collector configuration.
Alternative Telemetry Backends
While this guide uses Grafana Tempo, the OpenTelemetry Collector can export to many other backends by changing the exporter configuration. Popular alternatives include:
- Jaeger - Open-source distributed tracing platform
- Grafana Cloud - Managed observability platform with traces, metrics, and logs
- Zipkin - Distributed tracing system
- Commercial platforms - Datadog, New Relic, Honeycomb, and others that support OTLP
To use a different backend, modify the exporters section in otel-collector-values.yaml to point to your chosen platform. The OpenTelemetry Collector's flexibility allows you to switch backends without changing your application instrumentation.
The exporters.otlp.endpoint value points to the Tempo service. Since both the OTEL Collector and Tempo are in the same namespace (monitoring), we can use the short service name tempo with port 4317. If they were in different namespaces, you would need the fully qualified DNS name: {service-name}.{namespace}.svc.cluster.local:{port}.
Install the collector»
1 | |
Get the collector endpoint»
To configure Spacelift to send traces to the collector, you need the collector's endpoint. First, verify the service name:
1 | |
Since Spacelift applications run in a different namespace (spacelift), you need to use the fully qualified DNS name. The endpoint will be something like:
1 | |
Note
Even though the collector uses gRPC protocol, the URL scheme must still be http://.
Maintenance and upgrades»
Similar to Tempo, the Helm chart version corresponds to the OTEL Collector version. To upgrade:
1 | |
Then upgrade to the desired version:
1 | |
Warning
Spacelift applications maintain long-lived gRPC connections to the OTEL Collector. During a collector upgrade or configuration change, these connections may be lost. After upgrading the collector, restart the Spacelift deployments to re-establish connections:
1 2 3 4 | |
Configure Spacelift»
Now that the tracing infrastructure is ready, configure Spacelift to send traces to the OpenTelemetry Collector.
Update the Spacelift environment variables»
The Spacelift services need two environment variables:
OBSERVABILITY_VENDOR- Set toOpenTelemetryto enable the OpenTelemetry backend.OTEL_EXPORTER_OTLP_ENDPOINT- The fully qualified domain name of the OTEL Collector service.
Update the spacelift-shared secret with these variables:
1 2 3 | |
Note
Make sure to adjust the endpoint URL if you used different service names or namespaces.
Restart the Spacelift deployments to apply the new configuration:
1 2 3 4 | |
Verify the setup»
Check the Spacelift logs to ensure there are no errors:
1 | |
If configured correctly, traces should start flowing to the OTEL Collector, which relays them to Tempo.
Info
Even if there are errors related to the OTEL Collector, Spacelift will continue to function normally - it just won't emit traces.
Install Grafana»
Now that the storage (Tempo) and collector (OTEL Collector) are set up, install Grafana UI to visualize the traces.
Install Grafana chart»
Create a values file for Grafana. Save the following as grafana-values.yaml:
| grafana-values.yaml | |
|---|---|
1 2 3 4 5 6 7 8 9 | |
Warning
Change these credentials to something secure for production use.
Install the Grafana chart:
1 | |
Access Grafana»
For initial testing, use port-forwarding to access Grafana:
1 2 3 | |
Open your browser and navigate to http://localhost:3000. Log in with the admin credentials you configured earlier.
Configure Tempo data source»
To connect Grafana to Tempo:
- In the Grafana UI, navigate to Connections → Data Sources.
- Click Add data source and select Tempo.
- Set the URL to
http://tempo:3200. - Do not enable the streaming option.
- Click Save & Test.
Since Grafana and Tempo are in the same namespace, you can use the short service name tempo without the fully qualified DNS name.
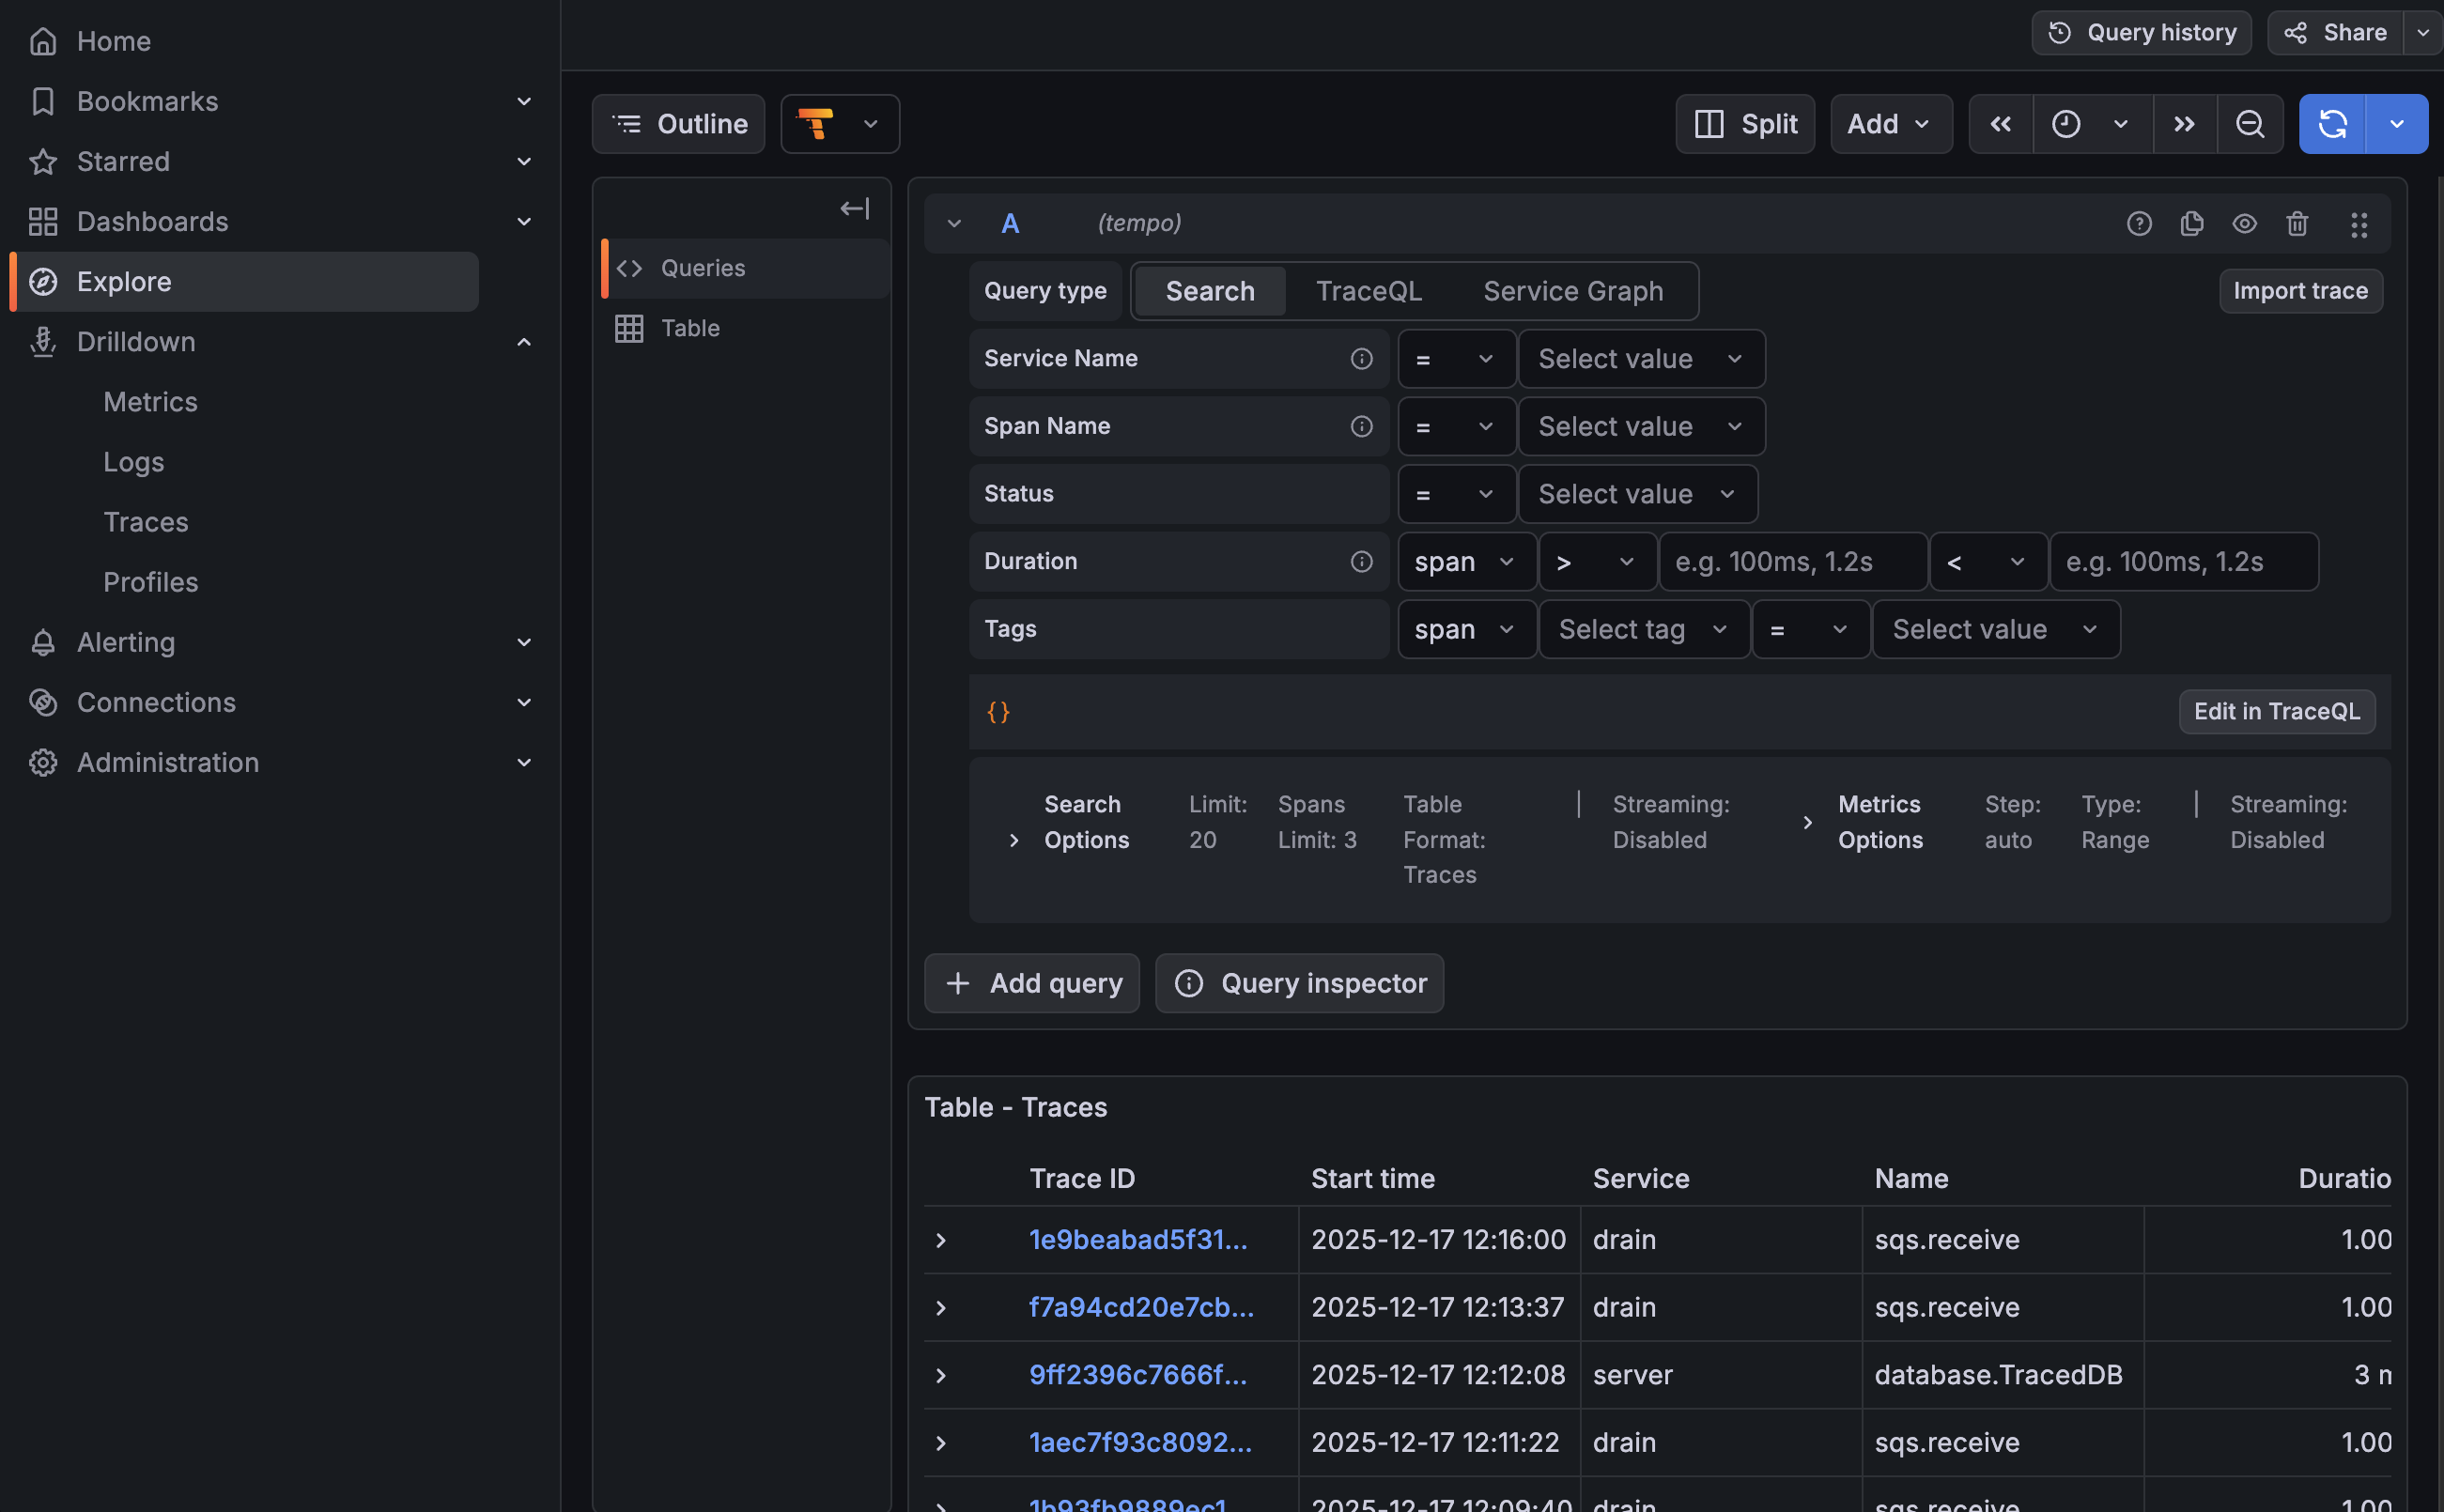
View traces»
Navigate to the Explore tab (http://localhost:3000/explore) and click the refresh button (♻️) in the top right. You should start seeing traces from Spacelift services.
Another useful view is to go to Drilldown → Traces in the left sidebar. You can filter traces by service name, operation name, duration, and time range.
Maintenance and upgrades»
To upgrade Grafana to a newer version:
1 2 | |
Exposing Grafana UI»
While port-forwarding is suitable for testing, production environments should expose Grafana via an Ingress or LoadBalancer with proper TLS termination.
Click to expand: Example for AWS EKS with ALB
Here's an example of how to expose Grafana using AWS Application Load Balancer with an ACM certificate. First, create an IngressClass and IngressClassParams:| grafana-ingressclass.yaml | |
|---|---|
1 2 3 4 5 6 7 8 9 10 11 12 13 14 15 16 17 18 19 20 21 22 23 24 25 | |
1 | |
1 | |
| grafana-values.yaml (with Ingress) | |
|---|---|
1 2 3 4 5 6 7 8 9 10 11 | |
1 | |
1 | |
| DNS Record | |
|---|---|
1 | |
Persistent storage for Grafana»
By default, Grafana stores its state (dashboards, users, folders, alert configurations) in a SQLite database file. If the container restarts and the data directory is ephemeral, you'll lose all changes including the Tempo data source configuration and custom dashboards.
To persist Grafana data, enable persistent storage by adding the following to your grafana-values.yaml:
| grafana-values.yaml (with persistence) | |
|---|---|
1 2 3 4 5 | |
Then upgrade the Grafana release:
1 | |
Troubleshooting»
If traces aren't appearing in Grafana after configuring the Tempo data source, here are the most common causes:
- Traces aren't reaching Tempo
- The Tempo pod restarted and lost traces (when using
localstorage) - Traces were deleted by Tempo's retention policy (if the retention period is too short)
Follow the steps below to diagnose where the issue is occurring:
Check Spacelift logs»
Spacelift applications log errors if they can't connect to the OTEL Collector. Check the logs:
1 | |
If the environment variable is properly set and there are no tracing-related errors, Spacelift is successfully sending traces to the OTEL Collector.
Note
Spacelift continues to function normally even if telemetry collection fails - it just won't emit traces.
Check OTEL Collector logs»
If Spacelift isn't reporting errors, check the OTEL Collector logs:
1 | |
Check Tempo logs»
Finally, check the Tempo logs to see if it's receiving and storing traces:
1 | |
Enable detailed span logging for debugging
If you need to verify whether Tempo is receiving traces, you can enable debug logging of all received spans. Add the following to your tempo-values.yaml:
| tempo-values.yaml (with debug logging) | |
|---|---|
1 2 3 | |
Then upgrade the Tempo release:
1 | |
This will log all spans received by the distributor, helping you determine if traces are reaching Tempo. Check the logs again after enabling this option. For more details, see the Grafana Tempo troubleshooting guide.
Warning
This flag generates significant log volume and should only be enabled temporarily for debugging purposes.
Cleanup and uninstallation»
If you need to remove the telemetry stack from your cluster, follow these steps to completely clean up all resources.
First, verify which releases are installed:
1 | |
Based on the output, uninstall the relevant releases:
1 2 3 | |
Finally, delete the monitoring namespace to remove all remaining resources:
1 | |
Note
If you're using persistent storage for Grafana, the PersistentVolumeClaims (PVCs) may need to be deleted separately depending on your storage class reclaim policy.
Disable Spacelift telemetry configuration»
If you've already set up the telemetry configuration in Spacelift, at this point it should throw errors since the OTEL Collector is no longer available. To fully disable telemetry in Spacelift, patch the spacelift-shared secret to clear the environment variables:
1 2 3 4 5 6 7 8 | |